Oracle’s JDBC Driver can export traces to an OpenTelemetry backend – let’s walk through how to configure this with Spring Boot 4 and Micrometer!
Just looking for the code? Click Here.
With OpenTelemetry tracing, you gain visibility into JDBC calls Oracle Database — making it easier to debug, optimize, and monitor your applications. We’ll collect traces from JDBC calls, export traces to an OpenTelemetry (Grafana LGTM stack) backend, and then view the traces online.
Project dependencies
To set up your project for OJDBC tracing, add these dependencies. We use Micrometer and Spring Actuator, exporting OJDBC traces via Grafana LGTM:
<dependency>
    <groupId>org.springframework.boot</groupId>
    <artifactId>spring-boot-starter-web</artifactId>
</dependency>
<dependency>
    <groupId>org.springframework.boot</groupId>
    <artifactId>spring-boot-starter-data-jdbc</artifactId>
</dependency>
<dependency>
    <groupId>com.oracle.database.spring</groupId>
    <artifactId>oracle-spring-boot-starter-ucp</artifactId>
    <version>${oracle.starters.version}</version>
</dependency>

<!-- OJDBC Tracing provider -->
<dependency>
    <groupId>com.oracle.database.jdbc</groupId>
    <artifactId>ojdbc-provider-opentelemetry</artifactId>
</dependency>
<!-- Observability / Tracing is implemented in Actuator. -->
<dependency>
    <groupId>org.springframework.boot</groupId>
    <artifactId>spring-boot-starter-actuator</artifactId>
</dependency>
<dependency>
    <groupId>org.springframework.boot</groupId>
    <artifactId>spring-boot-starter-opentelemetry</artifactId>
</dependency>Configure the OJDBC provider
On your JDBC connection string, ensure the oracle.jdbc.provider.traceEventListener=open-telemetry-trace-event-listener-provider parameter is provided:
# Tracing Configuration
management:
  opentelemetry:
    tracing:
      export:
        otlp:
          # OTEL collector endpoint
          endpoint: http://localhost:4318/v1/traces
  tracing:
    export:
      otlp:
        enabled: true
    sampling:
      # Send 100% of spans
probability: 1Configure Tracer bean
Because OJDBC tracing uses GlobalOpenTelemetry, we use a TracingConfigurator class initialize the GlobalOpenTelemetry object with Spring Boot’s OpenTelemetry bean:
package com.example.tracing.jdbc;

import io.opentelemetry.api.GlobalOpenTelemetry;
import io.opentelemetry.api.OpenTelemetry;
import org.springframework.beans.factory.InitializingBean;
import org.springframework.stereotype.Component;

@Component
public class TracingConfigurator implements InitializingBean {
    private final OpenTelemetry openTelemetry;

    public TracingConfigurator(OpenTelemetry openTelemetry) {
        this.openTelemetry = openTelemetry;
    }

    @Override
    public void afterPropertiesSet() {
        GlobalOpenTelemetry.set(openTelemetry);
    }
}
This component ensures OJDBC uses Spring Boot’s tracing configuration.
Start the demo app
From the spring-boot-jdbc-tracing directory, start Oracle Database Free and Grafana LGTM containers with docker-compose:
docker-compose -d
As the database starts, the grant_permissions.sql is run, creating a test user and a table.
Next, start the Java Spring Boot application using Maven:
mvn spring-boot:run
The app exposes a basic REST API on port 8080. Let’s POST a record to the API, creating a trace and database spans:
curl -X POST http://localhost:8080/flavors \
  -H "Content-Type: application/json" \
  -d '{"flavor": "Mint Chocolate Chip"}'
View traces in Grafana
To view traces from the sample app in the Grafana UI, useing the container URL http://localhost:3000/a/grafana-exploretraces-app
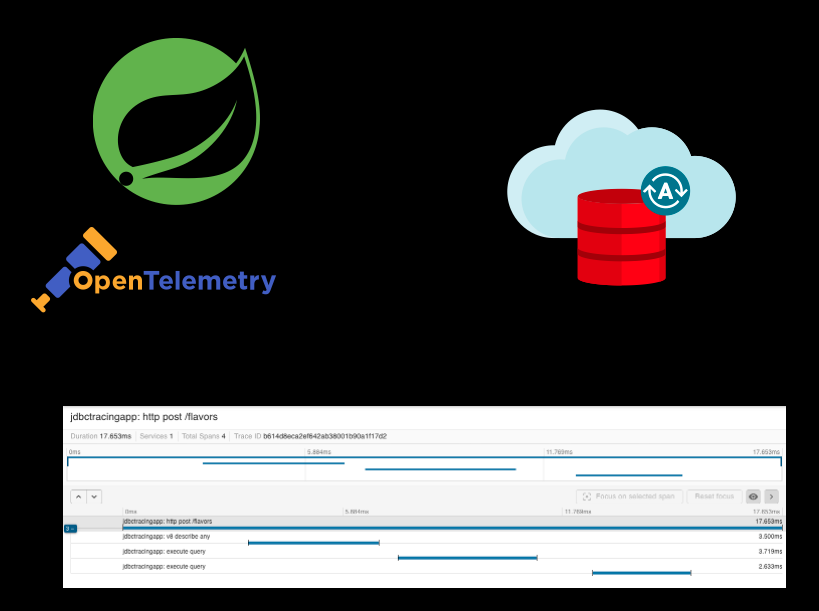
Next, click “Traces” to find all traces, and click on a trace. You’ll see the HTTP request span, and then spans from the JDBC driver:

Each database span has information from the JDBC driver, like the connection ID or database user. For example, examine the execute query span:

Configure OJDBC Tracing System Properties
The OJDBC tracing provider can be configured with Java system properties.
oracle.jdbc.provider.opentelemetry.enabled
Set this property to true to enable the provider. Enabled by default.
oracle.jdbc.provider.opentelemetry.sensitive-enabled
Set this property to true to export sensitive data, like SQL query text. Disabled by default.
Leave a Reply