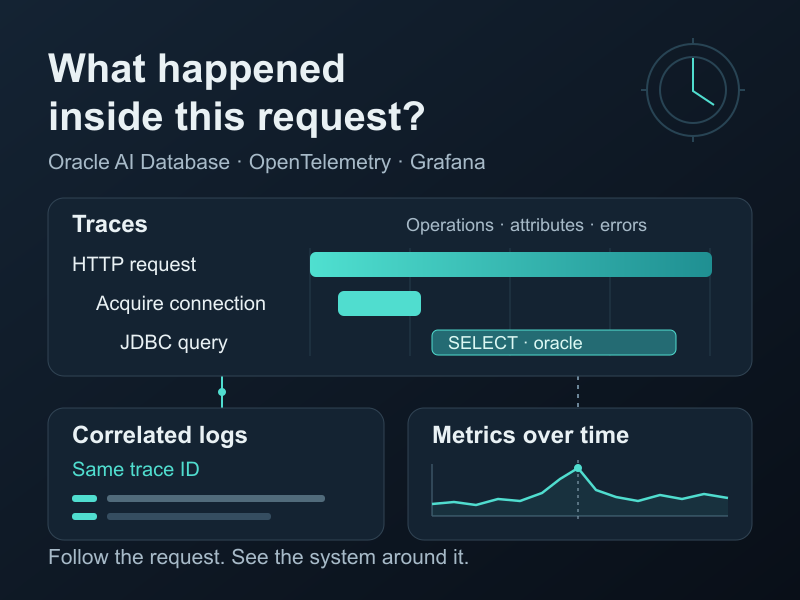
A production request slows down. Was it waiting for a connection or executing SQL? Was the database busy, and which logs belong to that request?
Open-source observability tools help connect the evidence across the application and Oracle AI Database. Trace spans capture operation timing, attributes, and errors. Correlated logs add request-specific details, while metrics show how latency, errors, and resource usage changed over time.
We’ll explore these signals with a simple Spring Boot application that queries Oracle AI Database Free through Universal Connection Pool (UCP) and exports telemetry to Grafana LGTM. We’ll follow a request through its JDBC calls and matching logs, then examine pool and database metrics to see what was happening around it.
End-to-end tracing, metrics, and logs
The sample Spring Boot app connects to Oracle AI Database Free, returns its trace ID, and sends telemetry to Grafana LGTM. A separate metrics exporter adds database context. OpenTelemetry is used to push data into Grafana LGTM: Tempo stores traces, Loki stores logs, and Prometheus stores metrics, with Grafana providing the interface for exploring them.

The lab uses Docker Compose for Oracle AI Database Free, Grafana LGTM, the metrics exporter, and an NGINX HTTPS proxy. The Spring Boot application runs on your host through Maven.
From the sample directory, start the infrastructure:
docker compose up -d --wait --wait-timeout 900Then start the application in another terminal:
mvn spring-boot:runCall the endpoint:
curl --fail \
  -H 'X-Client-Id: blog-demo' \
http://localhost:8081/api/readingsFor continuous traffic, run:
./workload.sh
The response contains a trace ID and session information observed by the database: module, action, client identifier, and session ID. Use the trace ID to find the request in Tempo and the session fields to identify its database context.
Open Grafana and select Dashboards → Oracle AI Database → Oracle AI Database end-to-end observability. Allow about a minute of traffic for rate and percentile panels to populate.

In Tempo, paste trace IDs to view end-to-end spans on database work: from the HTTP request to the database server.

From the trace in Tempo, follow the link to Loki and find the application log with the same trace ID. The “Read 2 readings…” message belongs to this request, so you can inspect its application context without searching through unrelated messages.
Diagnostic context for database apps
Traces describe a single request, metrics help us understand the state of the system around that request.
The Oracle AI Database Metrics Exporter provides database metrics. In the lab, it collects database metrics every 15 seconds and pushes them to Grafana LGTM over OTLP/gRPC. The dashboard brings database sessions and PDB tablespace utilization alongside application latency, errors, and UCP connection-pool metrics.

If a request is slow, inspect its JDBC spans, then check connection-pool acquisition time, pending requests, and database metrics over the same window. Those trends can reveal pressure that helps explain the request’s timing.
The exporter includes default database metrics and supports custom metrics defined with SQL queries in YAML or TOML. It can expose metrics for Prometheus collection, push them through OTLP/gRPC, or support both paths.
See the exporter documentation for setup and customization, and the OTLP publishing guide for configuration details.
Putting it all together
Observability brings the application and database into the same investigation. You can follow a request through its JDBC calls and database execution, read the logs that belong to it, and check what the connection pool and database were doing at the time. Together, those details help explain where the request spent its time and what might have affected it.
A forthcoming post will explore ORDS metrics, logs, and traces using the same stack. If you want to try it now, enable the optional ords profile in the lab.
References
- Oracle AI Database Metrics Exporter: GitHub repository and documentation.
- Database server-side tracing: Database Observability and OpenTelemetry and the
DBMS_OBSERVABILITYreference. - UCP metrics: Connection-pool runtime statistics.
- UCP Spring Boot integration: Data source configuration and Micrometer metrics.
Lab source code
- Lab README — setup, walkthrough, optional ORDS profile, and troubleshooting.
- Docker Compose stack — infrastructure services and their connections.
- Application configuration — UCP, JDBC observability, and telemetry export.
- Readings controller — SQL execution, request observation, and correlated logging.
- Connection decorator — session identity and JDBC server-telemetry settings.
- Database observability setup — native tracing service and export endpoint.
- Metrics exporter configuration — database connection, collection interval, and OTLP destination.
- Grafana dashboard — application, connection-pool, and database panels.
Leave a Reply