Oracle REST Data Services (ORDS) is a great addition to your Oracle AI Database stack. But, do you know how to configure ORDS observability?
In this article, we’ll demonstrate how to collect telemetry data from ORDS that shows what happens during HTTP request processing, which SQL operations ran, what ORDS logged, and the state of the ORDS connection pool.
This lab builds on the Full-Stack Oracle Observability Lab, using OpenTelemetry to collect observability data from ORDS with Oracle AI Database Free. You can check out the code on GitHub; if you like the lab, give the repo a star!
ORDS Observability with OpenTelemetry and Grafana
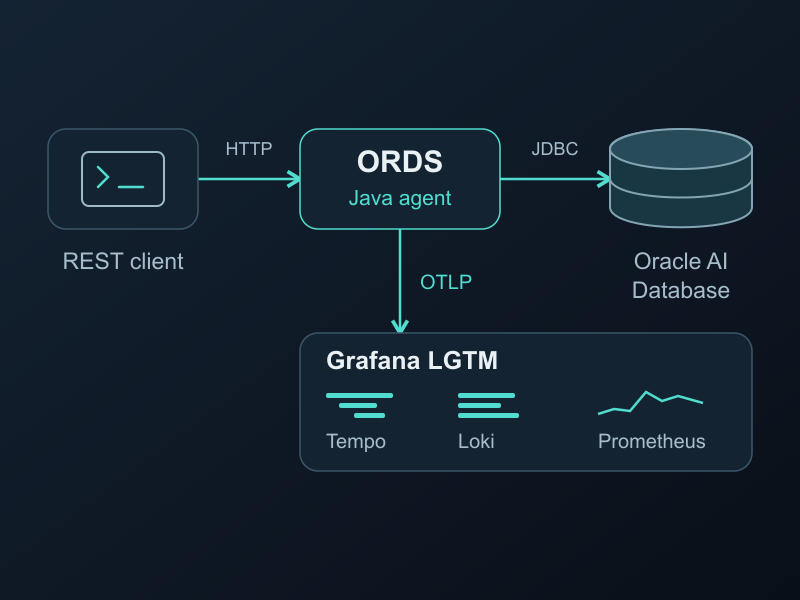
In the lab, ORDS runs as a container with the OpenTelemetry Java Agent attached. The agent sends telemetry to the OpenTelemetry Collector inside Grafana LGTM. Tempo stores traces, Loki stores logs, and Prometheus stores metrics.
Installing the OpenTelemetry agent and configuring ORDS in the Dockerfile. Always use the latest agent version:
FROM container-registry.oracle.com/database/ords:latest

# Pin the agent and verify the release artifact at build time.
RUN curl -fsSL https://github.com/open-telemetry/opentelemetry-java-instrumentation/releases/download/v2.33.1/opentelemetry-javaagent.jar \
        -o /opt/oracle/ords/opentelemetry-javaagent.jar \
    && echo 'e43a270df53c6f423e0ab157be9c27ccc01d5dc3232e162fe54777573db2f149  /opt/oracle/ords/opentelemetry-javaagent.jar' | sha256sum -c -

# Keep installation and SQLcl commands free of instrumentation.
RUN mv /opt/oracle/ords/bin/ords /opt/oracle/ords/bin/ords-original
COPY --chown=oracle:oinstall serve-with-agent.sh /opt/oracle/ords/bin/ords
RUN chmod +x /opt/oracle/ords/bin/ords
COPY setup-schema.sh /ords-entrypoint.d/10-setup-schema.sh
COPY schema.sql /opt/oracle/lab-schema.sqlThe lab attaches the Java agent when starting ords serve, following the approach described in the ORDS OpenTelemetry documentation.
Agent attachment uses the serve-with-agent.sh script:
if [[ "${1:-}" == "serve" ]]; then
    set -- --java-options "-javaagent:/opt/oracle/ords/opentelemetry-javaagent.jar" "$@"
fi
exec /opt/oracle/ords/bin/ords-original "$@"The environment variables configured in the lab look like this:
OTEL_SERVICE_NAME: ords
OTEL_EXPORTER_OTLP_ENDPOINT: http://grafana-lgtm:4318
OTEL_EXPORTER_OTLP_PROTOCOL: http/protobuf

OTEL_TRACES_EXPORTER: otlp
OTEL_METRICS_EXPORTER: otlp
OTEL_LOGS_EXPORTER: otlp

OTEL_METRIC_EXPORT_INTERVAL: "15000"
OTEL_TRACES_SAMPLER: always_on
OTEL_INSTRUMENTATION_JAVA_UTIL_LOGGING_ENABLED: "true"The service name identifies ORDS across the telemetry signals. The collector endpoint uses its Compose service address because ORDS runs inside the container network.
The Oracle AI Database Metrics Exporter runs separately, adding complementary database metrics.
Start the lab with ORDS enabled
You’ll need Docker with Compose v2 and at least 8 GB of memory allocated to Docker. From the lab directory, enable the ords profile with Docker Compose:
docker compose --profile ords up \
-d --build --wait --wait-timeout 900This starts ORDS alongside the database and observability services. On its first start, ORDS installs its metadata and enables the lab’s REST endpoint.
Follow a request through ORDS

First, generate some continuous traffic with the workload.sh script:
ORDS_URL=http://localhost:8888/ords/lab/readings/ ./workload.shMetrics export every 15 seconds; allow about a minute of traffic for rate and p95 panels to populate.
Open Grafana and select Dashboards → Oracle AI Database → ORDS observability.
Use the ORDS traces link, or select Tempo in Explore and search:
{ resource.service.name = "ords" }
Open a request to /ords/lab/readings/. Its trace connects the HTTP request with operations beneath it, including connection acquisition, dispatch, and JDBC work against LAB_READINGS_REST.

The ORDS dashboard brings together HTTP request rate and p95 latency, UCP connection usage and pending requests, JVM memory and CPU, and runtime logs.

ORDS metrics come from the Java agent. Database metrics come from the Oracle AI Database Metrics Exporter.
When you’re done with the lab, stop the workload and shut down the containers:
docker compose --profile ords down
Leave a Reply